Monitoring Claude usage using Envoy AI gateway
Observability used to be mostly about system health—CPU, latency, and error rates. In the age of LLMs, that’s only part of the story. Understanding usage, tracking costs, and evaluating output quality have become just as important as monitoring infrastructure performance.
The gap is not visibility — it is meaning.
In a conventional microservices system:
- errors are explicit (5xx, timeouts)
- performance regressions are measurable (CPU, DB latency)
- success is binary (request succeeded or failed)
With LLM systems:
- responses can be technically successful but semantically wrong
- latency can be acceptable but token cost silently increases
- outputs can degrade in quality without triggering any alerts
- different models behave inconsistently under identical prompts
So you end up with dashboards that look healthy, while:
- cost increases unexpectedly
- response quality degrades
- latency varies by provider/model
- traffic distribution becomes inefficient
This is the core limitation of traditional observability in AI systems.
An AI Gateway is a proxy layer that sits between applications and LLM providers (such as AWS Bedrock, OpenAI, Anthropic, or self-hosted models).
Instead of treating LLMs as external APIs, it treats them as managed upstream services.
In this setup, the gateway becomes responsible for:
- routing requests to different models/providers
- applying rate limits and usage policies
- enforcing security controls
- collecting telemetry on requests and responses
- standardizing traffic behavior across providers
The decision to use Envoy AI Gateway was not driven by feature overlap with existing tools, but by where it operates in the stack.
It provides a network-level control and observability layer for LLM traffic that traditional monitoring systems do not capture.
Key reasons:
All LLM calls (from CLI tools and applications) are routed through a single proxy layer, making it possible to observe:
- request volume per model/provider
- latency distribution across models
- traffic patterns by client (Cline vs CLI vs apps)
This removes fragmentation of LLM observability across tools.
Unlike traditional dashboards that only see aggregated metrics, Envoy provides visibility at the request level:
- upstream selection (which model handled the request)
- request latency per provider
- retry and failure behavior
- token-level metadata (where available through integration)
This makes it possible to correlate:
“which model + which request pattern caused cost or latency changes”
Since the system already uses:
- Kubernetes
- Prometheus
- Grafana
Envoy AI Gateway integrates naturally into this pipeline:
- Prometheus scrapes Envoy metrics
- Grafana visualizes request-level AI traffic behavior
This keeps the stack consistent and avoids introducing a parallel telemetry system.
Even without complex AI decision logic, Envoy enables:
- routing requests across upstream LLM providers (e.g., Bedrock models)
- enforcing rate limits at gateway level
- applying consistent retry and timeout policies
This ensures that all clients behave consistently regardless of how they call the LLM.
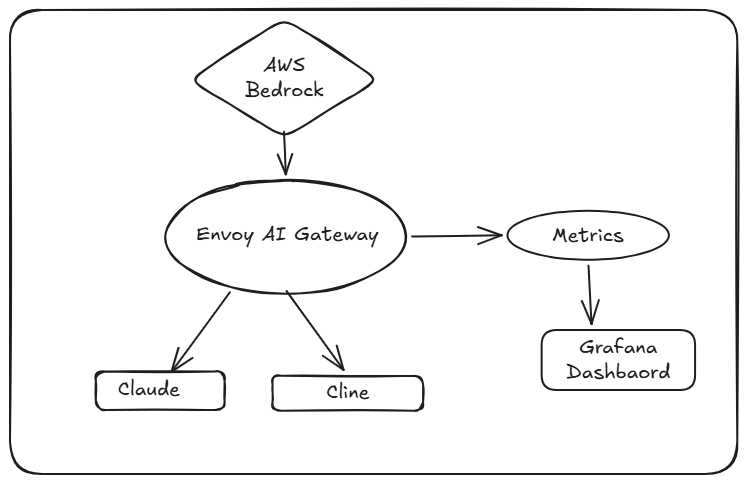
By exposing Envoy AI Gateway as the single endpoint:
- Claude CLI
- Cline
- local applications
all use the same interface.
This simplifies:
- debugging
- observability correlation
- usage tracking per tool
With Envoy AI Gateway + Prometheus + Grafana:
-
LLM usage becomes measurable at request level, not just aggregated API logs
-
cost and latency patterns can be correlated per model/provider
-
CLI tools and applications can be compared under the same traffic model
-
performance anomalies become traceable through the gateway layer
- An AWS account with access to AWS Bedrock.
- A Kubernetes cluster (EKS, GKE, AKS, or Docker Desktop) to deploy the Envoy AI Gateway.
- kubectl configured to access your Kubernetes cluster.
- Basic knowledge of Kubernetes and Envoy Proxy.
- helm installed for deploying the Envoy AI Gateway.
Run these commands to verify your tool installations:
Verify kubectl installation:
Kubernetes Cluster should be 1.32 and higher for Envoy AI Gateway compatibility. You can create a cluster using EKS, GKE, AKS, or Docker Desktop.
Uninstalling any existing Envoy Gateway deployments before proceeding:
helm uninstall eg -n envoy-gateway-systemkubectl delete namespace envoy-gateway-systemEnvoy AI Gateway is built on top of Envoy Gateway. Install it using Helm and wait for the deployment to be ready.
helm upgrade -i eg oci://docker.io/envoyproxy/gateway-helm \  --version v1.7.2 \  --namespace envoy-gateway-system \  --create-namespace \  -f https://raw.githubusercontent.com/envoyproxy/ai-gateway/main/manifests/envoy-gateway-values.yaml
kubectl wait --timeout=2m -n envoy-gateway-system deployment/envoy-gateway --for=condition=AvailableStep 1: Install AI Gateway CRDs First, install the CRD Helm chart (ai-gateway-crds-helm) which manages all Custom Resource Definitions:
helm upgrade -i aieg-crd oci://docker.io/envoyproxy/ai-gateway-crds-helm \ --version v0.0.5.0 \ --namespace envoy-ai-gateway-system \ --create-namespaceStep 2: Install AI Gateway Resources After the CRDs are installed, install the AI Gateway Helm chart:
helm upgrade -i aieg oci://docker.io/envoyproxy/ai-gateway-helm \  --version v0.5.0 \  --namespace envoy-ai-gateway-system \  --create-namespace
kubectl wait --timeout=2m -n envoy-ai-gateway-system deployment/ai-gateway-controller --for=condition=Available
Verify Installation Check the status of the pods. All pods should be in the Running state with Ready status.
Check AI Gateway pods:
kubectl get pods -n envoy-ai-gateway-systemConnect AWS Bedrock
Prerequisites:
- AWS credentials with access to Bedrock
- Basic setup completed from the Basic Usage guide
- Basic configuration removed as described in the Advanced Configuration overview
- Enabled Claude model access in the us-east-1 region (see AWS Bedrock Model Access)
We will use static credentials for this example, but in production, consider using AWS IAM roles for secure credential management.
- Download and configure the AWS example manifest:
curl -O https://raw.githubusercontent.com/envoyproxy/ai-gateway/refs/tags/v0.5.0/examples/basic/aws.yaml- Edit “aws.yaml” and replace the credential placeholders:
AWS_ACCESS_KEY_ID: Your AWS access key ID
AWS_SECRET_ACCESS_KEY: Your AWS secret access key
Also can customize model for Model you need, here llama and Claude sonnet are used 3. Apply and test
kubectl apply -f aws.yaml
kubectl wait pods --timeout=2m \-l gateway.envoyproxy.io/owning-gateway-name=envoy-ai-gateway-basic \-n envoy-gateway-system --for=condition=Ready- Test the gateway with a sample request:
export GATEWAY_URL=$(kubectl get gateway envoy-ai-gateway-basic -n default -o jsonpath='{.status.addresses[0].value}')curl -H "Content-Type: application/json" \ -d '{ "model": "anthropic.claude-3-5-sonnet-20241022-v2:0", "messages": [ { "role": "user", "content": "What is capital of France?" } ], "max_tokens": 100 }' \ $GATEWAY_URL/anthropic/v1/messagesExpected output:
{ "id": "msg_01XFDUDYJgAACzvnptvVoYEL", "type": "message", "role": "assistant", "content": [ { "type": "text", "text": "The capital of France is Paris." } ], "model": "claude-3-5-sonnet-20241022", "stop_reason": "end_turn", "usage": { "input_tokens": 13, "output_tokens": 8 }}For more troubleshooting and advanced features, see Envoy AI Documentation (opens in a new window)
Envoy AI Gateway collects metrics and exports them to Prometheus using the OpenTelemetry format. This follows the OpenTelemetry Gen AI Semantic Conventions (opens in a new window).
Apply the monitoring configuration:
kubectl apply -f https://raw.githubusercontent.com/envoyproxy/ai-gateway/main/examples/monitoring/monitoring.yamlWait for the monitoring pods to start, then forward Prometheus locally:
kubectl port-forward -n monitoring svc/prometheus 9090:9090Open “http://localhost:9090 (opens in a new window)” to access the Prometheus dashboard.
You can install Grafana in the cluster using Helm, or run it locally with Docker Desktop for simplicity.
“docker-compose.yaml”
grafana:  image: grafana/grafana-enterprise:latest  container_name: grafana  restart: unless-stopped  ports:    - '3000:3000'  volumes:    - grafana-storage:/var/lib/grafana
volumes: grafana-storage:docker compose up -dNavigate to “http://localhost:3000 (opens in a new window)”.
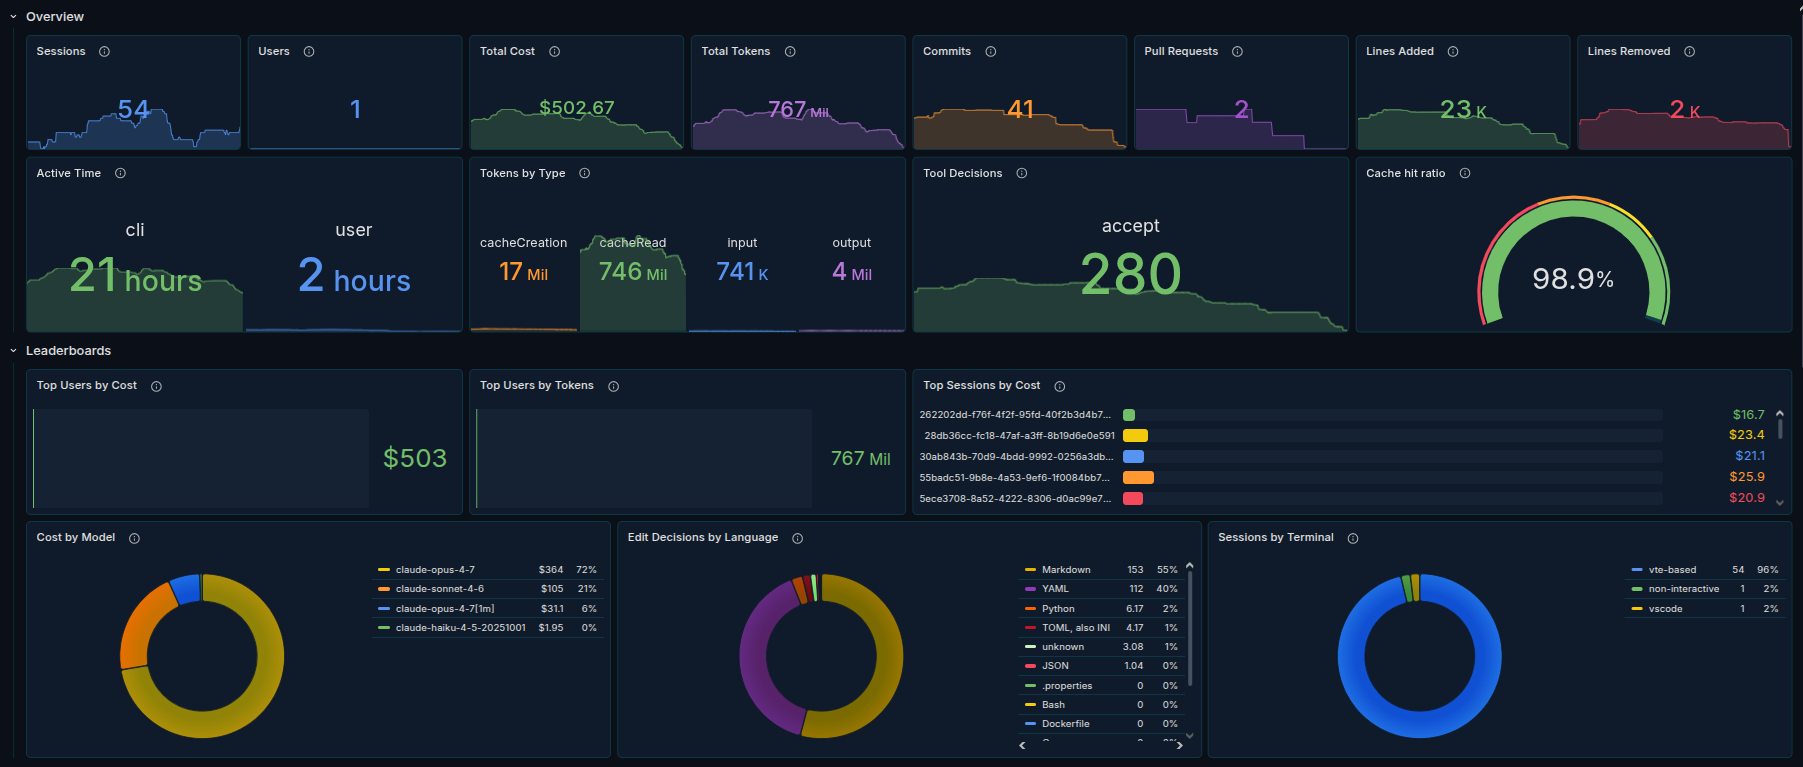
- Add Prometheus as a data source using Connections > Add new connection > Prometheus.
- Run queries in Explore > Prometheus.
- Create a dashboard for Claude by importing an existing Prometheus as Data source from here
We Can setup claude using following commands if using Claude cli
export GATEWAY_URL=$(kubectl get gateway envoy-ai-gateway-basic -n default -o jsonpath='{.status.addresses[0].value}')export ANTHROPIC_BASE_URL=GATEWAY_URL/anthropicexport ANTHROPIC_API_KEY=""claude --model claude-sonnet-3-5Cline is used as VS Code extension, here are settings
API Provider: Anthropic
User Custom Base URL: http://host.internal/anthropic (opens in a new window) **Note: As its on Docker Desktop
Model: claude-sonnet-3-5 **Note: Choose your own Model
Comments
Join the conversation
Add a quick note for other readers. Comments are stored locally in your browser so you can keep track of your thoughts on this post.